
Visualizing AI Data Flows
Making the Invisible Visible
In the previous article, we introduced AI data modeling as an extension of traditional data management practices. We explored why AI introduces new patterns that traditional models don't capture, and why existing data management principles remain critical. Now we'll make this concrete: how do you actually visualize, document, and operationalize AI-augmented workflows?
Traditional data flow diagrams show how information moves through systems, from input to storage to output. But when AI enters the picture, critical details become invisible.
- Where does AI interpret unstructured data?
- Which AI model processes sensitive information?
- Where do humans review AI decisions?
- How do prompts transform data from one form to another?
- How do we test whether an AI workflow still works after a model upgrade?
AI data flows extend traditional data modeling to make AI touchpoints explicit, governable, and reusable.
Building on What We Know
Data modeling has always served as a bridge between business requirements and technical implementation. At a conceptual level, it defines what data a business needs: entities like Customer, Claim, or Permit. At a logical level, it structures that data with attributes, relationships, and constraints. At a physical level, it specifies implementation details: database tables, column types, indexes.
Data flows specifically show movement and transformation: a document arrives, gets validated, moves to storage, undergoes processing, and produces output.
These principles haven't changed. But AI introduces new layers of metadata that become critical to document and understand.
Consider what happens when AI enters a workflow. An AI processing node isn't just "transform data" - it's "AI extracts entities using claude-sonnet-4.5 with prompt version 2.3, requiring 0.85 confidence threshold before proceeding." That level of detail matters for operations, compliance, and continuous improvement.
Human checkpoints take on new significance. Where AI suggests and humans approve (human-in-the-loop), we need to know:
- Which role performs this review?
- What's the expected turnaround time?
- What information does the reviewer need to make informed decisions?
Data classification becomes more nuanced. It's not enough to say, "this database contains customer data." We need to specify: "this node processes protected health information, must not use external AI APIs, requires audit logging, and falls under PIPEDA compliance requirements."
Prompts function as transformation logic. Just as a SQL query transforms raw data into an aggregate report, a prompt transforms an unstructured document into structured JSON. Both deserve versioning, testing, and documentation.
Integration realities constrain what's possible. Can a system provide real-time data via API? Must AI work with batch file exports? Is manual entry the only option? These constraints shape how AI workflows can be designed.
The physical layer analogy extends naturally to AI. Just as physical data models specify database tables and column types, AI data flows specify which model/version to use, context window composition, prompt templates, writing samples for style guidance, and fallback strategies when confidence is low.
Metadata That Matters
AI data flow diagrams use familiar elements (data sources, storage systems, manual processes) but add AI-specific components that need explicit representation.
- AI Service nodes capture critical operational details. Each includes model details, the AI capability type (extraction, classification, summarization, etc.), confidence thresholds that determine routing decisions, references to prompt templates in your library, and writing samples used for tone and style consistency.
- Human Checkpoint nodes define review processes. They specify the task type (verify, approve, modify, review), the required role (e.g., Clinician, Claims Adjuster, Building Inspector, Manager), and service level agreement expectations.
- Data Sources and Sinks get enhanced annotations. They identify which enterprise system they connect to (linking to your system integration landscape), the integration method available (REST API, file export, manual entry), data classification levels (PHI, PII, Public), and applicable compliance requirements (PIPEDA, HIPAA, GDPR).
Visual cues make patterns immediately apparent. Security classifications might use color coding: PHI highlighted in red, PII in yellow, public data in green. Compliance badges show applicable regulations. Integration methods can use different line styles: solid lines for real-time APIs, dashed for batch transfers, dotted for manual processes.
The same underlying model can generate different views for different audiences:
- The technical view shows systems, APIs, file formats, and transformation logic: what developers need to build and maintain the solution.
- The compliance view highlights where sensitive data flows, required controls, and audit points: what privacy officers need to approve the design.
- The skills view shows which AI capabilities are used by which teams: what HR and training coordinators need for workforce planning.
- The business process view abstracts technical details to show roles and decisions: what business stakeholders need to understand value and impact.
This is the power of proper abstraction - model once, view many ways. The same underlying data structure supports multiple perspectives without duplication or inconsistency. Change the model, and all views update automatically. This wouldn't be possible with ad-hoc documentation in scattered documents.
Understanding Your System Landscape
Before designing AI data flows, you need to understand integration realities. AI opportunities are constrained, or enabled, by how systems communicate.
Imagine wanting to auto-fill permit applications from uploaded PDFs. Critical questions immediately arise: Where does permit data currently live? Do the PDFs require conversion to image before OCR? Can you read and write via API for real-time integration, or only via nightly file export, requiring batch workflows? Or does no integration exist, making document-based workflows the only viable option?
That last scenario (no integration) is where AI often provides the most value. When systems can't talk to each other via APIs, AI can bridge the gap by reading unstructured inputs and writing structured data. This is why document-heavy industries like legal, healthcare, insurance, and government see massive AI impact.
Mapping your system landscape provides essential context. Systems become nodes in a graph: ERP, CRM, GIS, HRIS, Document Management, industry-specific applications. Integration methods become edges connecting them.
These edges carry important metadata. Real-time REST APIs enable low-latency, bidirectional communication. Batch file transfers happen on schedules and flow one direction. Manual entry means no automation exists and errors are likely. Legacy systems might offer limited read-only access. Additional annotations capture data volume, frequency, and constraints like firewall restrictions.
This landscape directly informs AI flow design:
- High integration maturity (a system with robust APIs) means AI can trigger actions and get immediate feedback, enabling real-time workflows.
- Medium maturity (systems that export files nightly) suggests overnight AI processing with morning review sessions.
- Low maturity (no API, just PDFs or scanned forms) points to document-based workflows where AI extracts data and humans verify before manual entry into systems.
The key insight: AI reduces the need for perfect integration. If systems can't talk to each other programmatically, AI can still read whatever format the data arrives in and structure it appropriately.
A Practical Example
Consider a simplified building permit application process. Understanding the system landscape helps us see where AI augmentation makes the most sense.
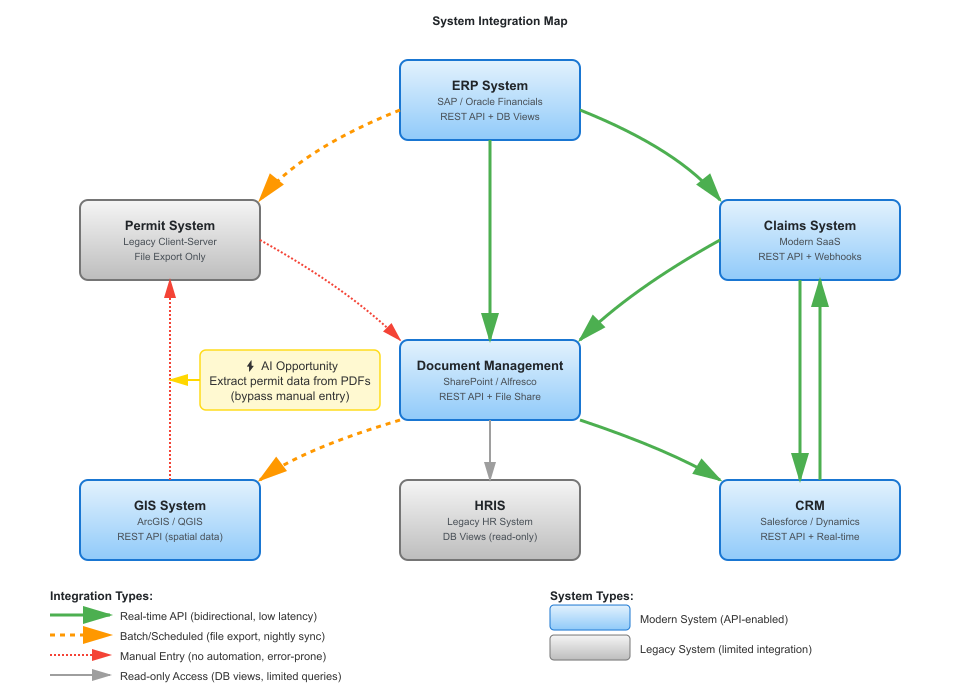
The system map above shows the integration landscape for a municipal government. Notice the Permit System in the left column - it's marked as "Legacy Client-Server" with "File Export Only." There's no API. Data goes in through nightly batch imports. This constraint shapes the entire data flow design.
Now consider how AI augmentation transforms the permit application process. Traditionally, an applicant submits a paper or PDF form. A clerk manually enters data into the Permit System. The system routes to the appropriate department for review.
An AI-augmented version might look like this:
Step 1: Document Intake
Permit applications arrive as PDF or DOCX files. The data is public record, but contains personally identifiable information (applicant name, address, property location). This node is tagged with PII classification.
Step 2: AI Classification
An AI service using claude-sonnet-4-5 classifies the permit type: Residential Addition, Commercial New Construction, Demolition, etc. The prompt template references version 2.1 from the prompt library. The confidence threshold is set to 0.90; anything below that gets flagged for manual classification.
This step demonstrates the classification capability from the AI taxonomy, a skill that transfers across many workflows. The same classification approach works for contract types, incident reports, or customer inquiries.
Step 3: AI Data Extraction
Once classified, a second AI service extracts structured data: applicant information, property details, scope of work, estimated cost. The output is XML formatted to match the Permit System's import schema.
Step 4: Staging Area
The auto-filled forms land in a staging area where they await human review. This is not a temporary holding area; the XML is retained for audit purposes and tagged with PII classification.
Step 5: Human Verification
A Permit Clerk reviews auto-filled forms, corrects any errors, and adds missing information. This task has a 24-hour SLA and requires the "Permit Clerk" role. The verification step ensures data quality before it enters the legacy Permit System.
This is a human-in-the-loop checkpoint. The AI has acted, but a human must verify before the data moves forward. This is especially important given the integration constraint: once data enters the Permit System via batch import, corrections are difficult.
Step 6: Permit System Import
The verified XML files are queued for the nightly batch import into the Permit System. Because there's no API, this batch process is the only integration option, which creates a natural daily processing cycle. This change provides meaningful time savings: clerks spend only 10 minutes verifying each permit instead of 45 minutes manually entering all data.
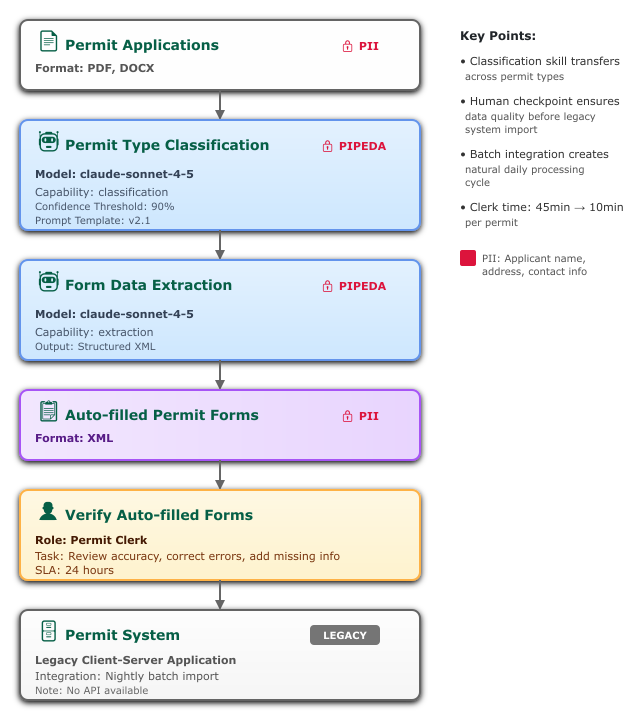
The diagram shows data classification (PII badges), compliance requirements (PIPEDA), integration constraints (batch import limitation), and human checkpoints with role requirements. Each element provides essential context for implementation, operation, and governance.
What does this diagram reveal to different stakeholders?
The technical team sees which AI models are in use, which prompts need maintenance, and the integration bottleneck: the Permit System's batch-only import creates a natural daily processing cycle. They know the extraction AI outputs XML because that's what the legacy system accepts.
The compliance officer sees that PII flows through AI services and can verify that models don't retain data. Human verification happens before final import. An audit trail exists for all AI actions (PIPEDA badge indicates logging).
Business stakeholders see clerk time reduced from 45 minutes per permit to 10 minutes of verification. The process is faster and more consistent. The batch constraint means permits submitted after 2 PM won't enter the system until the next business day, which sets expectations for customer service.
HR and training coordinators see that clerks need skills in "data extraction verification", which means reviewing AI output for accuracy. These are transferable skills that apply to other permit types and even other domains like contract review or invoice processing. The classification capability shown in Step 2 is a reusable pattern worth teaching.
One Implementation: Tag Blueprint
nSymbol Tag is a desktop application originally designed for healthcare and education workflows like clinical reports and student intake. It includes four internal apps:
- Scribe for document generation
- Automate for AI Chains that bundle context and prompts into one-click actions
- Dashboard with getting-started wizards and shortcuts
- Blueprint for AI data modeling (currently available to consulting clients only)
Blueprint creates machine-readable AI data flow models built on OWL (Web Ontology Language) semantic models. These support rich relationships between components and flexible SPARQL queries. For example, find all flows using a particular AI model, all prompts implementing a specific capability, all nodes processing PII.
The application includes directed graph visualization where nodes represent classes and individuals, and edges represent properties. This provides an interactive way to explore and enhance data models.
Why use OWL ontologies? If these technical terms sound daunting, don't worry - the concepts matter more than the specific technologies. You can apply this methodology with simpler tools (spreadsheets, databases, even well-organized documents) and still get most of the value. But there are advantages to formal semantic approaches:
For humans, ontologies provide formal, precise definitions where relationships are explicit rather than buried in code. The SPARQL query language offers powerful search capabilities, like SQL for semantic data. Want to find all workflows using a specific AI model? All prompts handling PII? All processes requiring a particular role? These queries become straightforward.
For AI, frontier models (especially Claude) understand OWL remarkably well. AI can help create ontologies from input documents, write queries to answer questions, and suggest enhancements. This creates a shared world model where humans and AI work with the same formal definitions.
For organizations, machine-readable formats enable automation, version control, and portability across tools since OWL is a W3C standard. But again: start with whatever tooling works for your team. Formalization can come later as complexity grows.
Tag's architecture prioritizes security through its desktop-first design. Files are stored locally rather than on remote servers. AI calls go directly from desktop to AI providers (Anthropic, Google, OpenAI and Cohere) without intermediary SaaS platforms storing your data.
The application is also HIPAA and PIPEDA aligned. Our Managed AI subscription bypasses standard AI vendor servers and guarantees no prompt retention by any party. Tag can be part of a compliant solution, assuming users handle desktop security appropriately. We don't claim "Tag is HIPAA compliant" because compliance requires organizational policies beyond software, but the architecture supports compliance requirements.
Importantly, you don't need Tag to apply this methodology. What you do need is:
- A way to visualize data flows (Visio, Lucidchart, draw.io, Inkscape, PowerPoint, or even hand sketches)
- A way to store metadata (spreadsheets, databases, ontologies, or structured documents)
- A way to query that metadata (SQL, SPARQL, spreadsheet filters, or even manual search)
- A way to version control your artifacts (Git, SharePoint, or even careful file naming)
nSymbol Tag is one implementation that formalizes the methodology in OWL, provides graph visualization, integrates with AI for assisted modeling, and bundles workflow tools (Scribe for document generation, Automate for AI Chains). The Blueprint modeling features are currently available through consulting engagements where we help organizations establish their first AI-augmented workflows and create reusable patterns.
But the AI data modeling concepts we've described apply regardless of tooling. Use what works for your team and your constraints.
From Diagram to Operations
A well-documented AI data flow enables clear operational practices.
Clear ownership emerges naturally. Each node has a responsible team or person. For AI services, someone maintains prompts and monitors performance. For human tasks, someone performs reviews with defined backup coverage.
Change management becomes straightforward. When upgrading models or changing AI vendors, you can identify which flows are affected and know which prompts need retesting. When regulations change, query all flows processing PII to assess impact. When teams restructure, identify which skills are needed and who has them.
Onboarding and training improve dramatically. New hires learn: "Here are the five flows you'll interact with. These are the AI capabilities involved. Here's where you perform reviews." Cross-training becomes explicit: "You've mastered entity extraction for permits, and the same skill applies to contracts and invoices."
Continuous improvement has clear metrics. Track processing time, error rates, and human override frequency per node. Identify bottlenecks: if human review takes three days but AI processing takes five minutes, focus on speeding up review processes. Spot reuse opportunities: if three teams write similar extraction prompts, create a shared capability.
Governance and audit requirements get addressed systematically. When auditors ask "Show me where AI processes protected personal information," you have documented answers with clear control points.
Common Failure Modes Without AI Data Modeling
We've seen consistent patterns in unsuccessful AI implementations. These aren't technology failures, they're methodology failures.
Prompt Sprawl
Teams write similar prompts independently, each solving document extraction or classification slightly differently. When models change or vendors switch, there's no inventory of what needs testing. Months of prompt engineering work exists only in email threads and individual files.
Security Drift
Initially secure configurations gradually expose sensitive data as workflows evolve without oversight. Someone adds a helpful feature that sends customer data to a new AI service. Nobody documents the change. Six months later, an audit reveals the compliance gap.
Capability Ignorance
Marketing develops a contact extraction capability. Three months later, Legal builds essentially the same thing for vendor agreements. Six months after that, Procurement creates their own version for purchase orders. Nobody knows what expertise exists elsewhere in the organization.
Integration Surprises
AI pilots work beautifully in isolation - impressive demos, happy stakeholders, budget approved. Then someone tries to connect them to production systems and discovers: the CRM doesn't have an API, the ERP requires manual data entry, the document management system is read-only, and the compliance system can't accept AI-generated content without human verification that wasn't in the original design.
Skills Gaps
Organizations realize too late that AI-augmented workflows require different human skills than they planned for. Staff hired to do data entry now need to verify AI extraction, a different skill requiring judgment about confidence scores and edge cases. Nobody planned for this transition or provided appropriate training.
These failures aren't inevitable. They're the predictable result of treating AI as a feature rather than an architectural element requiring deliberate design. AI data modeling prevents these failure modes by making AI touchpoints explicit, governable, and documentable from the start.
Getting Started
Start with one workflow you know well. Diagram it as it exists today using traditional flow concepts.
Identify where AI could assist: unstructured input that could be extracted, repetitive interpretation tasks, pattern recognition across large volumes, or content generation from structured data.
Sketch the AI-augmented flow. Add AI service nodes with their models and capabilities. Add human checkpoints with roles and expectations. Annotate with data classification. Note integration constraints.
Share with stakeholders. Have your technical team validate feasibility. Get compliance to review controls. Confirm with business stakeholders that the value justifies the effort.
Then implement a pilot, measure results, and refine the model based on what you learn.
Creating Diagrams with AI
The diagrams in this article were created by asking Claude Sonnet to generate SVG code from text descriptions. The process is surprisingly effective: describe the system or flow you want to visualize, ask for SVG output, save the result to a file, and open it in a free editor like Inkscape.
You'll typically need to adjust alignment and refine labels as your understanding improves, but Inkscape makes this easy. It works much like Visio for moving, aligning, and editing diagram objects. When you're done, display the SVG in a web browser, capture it with a screenshot tool, and paste into an image editor to save as PNG. You can also embed SVG graphics directly within HTML documents.
The real power emerges when your diagram is backed by a machine-readable model. SVG by itself isn't ideal as a data model (it's presentation-focused) but it can be translated back and forth. Keeping your diagrams as SVG means you can send them back to AI for iterative improvements. Sending PNG images to AI only works for OCR at this stage, not for modifying the diagram structure.
For the underlying data model, you have options:
- XML or JSON work but require custom programming or tools that support them (nSymbol Tag's Automate app can help with this).
- SQL databases work well but need SQL development resources.
- Ontologies work best for complex relationships and queries, but also require custom programming or tools that support them (Tag's Blueprint app provides this capability).
This workflow demonstrates why Tag's architecture is effective: the combination of formal ontology models, graph visualization, and AI integration creates a system where diagrams and data models stay synchronized, and AI can assist throughout the modeling process.
Making AI Visible
AI data flows make the invisible visible. They extend traditional data modeling to explicitly represent where AI interprets data, which models and prompts perform transformations, where humans review and decide, how sensitive data is protected, and which systems can or cannot integrate.
This visibility enables better design, clearer governance, and more effective knowledge sharing. The methodology works with many kinds of tooling. Start simple, iterate, and build organizational capability over time.
Next: AI Roles: Managing Model Complexity
Making the right AI model decision once, applying it everywhere